
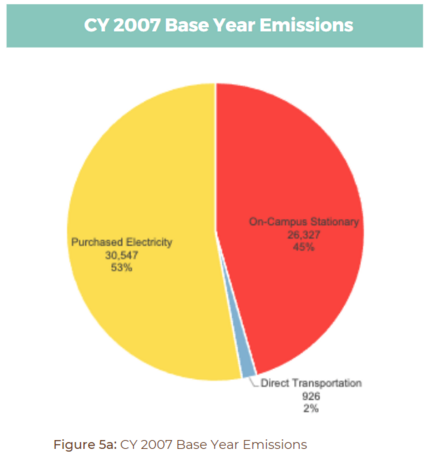
Lehigh has completed GHG inventories annually since 2007. Historically, LU Facilities utilized energy and fuel consumption data as well as emissions data from the Environmental Protection Agency to quantify Scope 1 and Scope 2 emissions. More recently, Lehigh has used the University of New Hampshire’s Sustainability Indicator Management and Analysis Platform (SIMAP) to track GHG emissions. SIMAP has become an industry standard for higher education institutions completing a GHG Inventory. Since 2007, Lehigh has significantly broadened emissions categories to show a more comprehensive picture of institutional emissions. Lehigh’s calendar year 2007 (Jan. 1 to Dec. 31, 2007) represents the university’s base year for calculating annual GHG emissions. At that time, Lehigh quantified natural gas and oil emissions representing on-campus stationary sources, gasoline and diesel fuel consumption for direct transportation, and purchased electricity. CY 2007 base year emissions were 57,800 MTCDe (see Figure 5a).
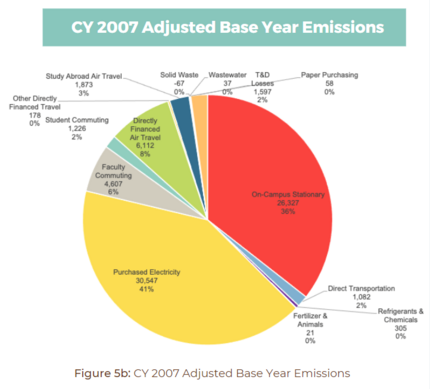
Lehigh’s current GHG inventory process has expanded to include emissions from the following sources: refrigerants, fertilizers, faculty/staff/student commuting, directly financed air and other travel, study abroad air travel, solid waste, waste water, paper purchasing and electric transmission and distribution. Because Lehigh’s process for evaluating campus emissions has become more thorough, an adjusted base year emissions calculation has been developed by accounting for new emissions categories using 2019 emissions figures. This is a common practice as many institutions and corporations have expanded GHG accounting practices since the early 2000s. Lehigh’s adjusted emissions for CY 2007 are 73,706 MTCDE (see Figure 5b).
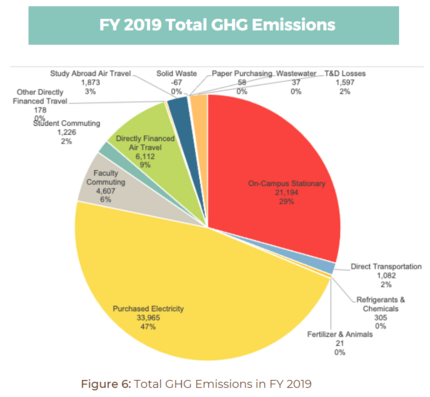
Due to the impacts of the COVID-19 pandemic on campus operations, FY 2020 emissions data was reviewed, but excluded from the Climate Action Strategy planning process. FY 2019 (July 1, 2018 to June 30, 2019), represents the most recent full year of reliable campus emissions, reflecting a “normal” year of campus operations. In FY 2019, GHG emissions were calculated by Lehigh University staff using the SIMAP tool with total emissions of 72,188 MTCDe (see Figure 6).